Unlocking Profitable Opportunities: My Chart Interpretation and Trading Ideas for Gold, GBP/USD, and EUR/JPY Next Week
- Johnny Deville

- Feb 9, 2025
- 3 min read
As we prepare for another week of trading, understanding the current market dynamics is essential. In this post, I'll share my chart analysis for gold, GBP/USD, and EUR/JPY, along with trading ideas tailored to the latest trends. By recognizing price movements and key levels, we can develop effective strategies that enhance our chances of success in the market.
Chart Analysis of Gold
Examining the 15 minutes chart for gold, it's clear we are experiencing a strong bullish trend. The price recently bounced off a significant support level around $2,500, which has psychologically acted as a safety net during the last correction and passed the november high which was around $2,800/ounce.
From there price accelerated in five waves just a little below $2,900 and if we are not breaking above I expect a little correction and a retest of the broken resistance turned support along with the ascending longer term trendline. I expect a strong demand zone around 2,810 and 2,830 that will push our pair in the next upper leg.
If gold breaks above the resistance level at $2,900 we could see a continued upward trend, potentially reaching around $3,000, extending a truncated wave five before a major correction will occur in which case I recommend a classic break and retest trade above the psychological level.

The Relative Strength Index (RSI) also shows that the market is not oversold, indicating there is still room for downward movement and multiplied MACD it's maintaining the buy signal which occurred at the end of january but its weakening. For next week, I recommend a longer term buy position if we establish support around $2,820, with a price target of $3,000 and a short term short position that will target the disputed support level if we break the intermediary trend line.
GBP/USD: A Look at Technical Patterns
Turning to GBP/USD, the one hour chart presents a mixed outlook. After reaching support around 1.21, the currency pair has begun to show signs of retracement. Specifically, the last four weeks indicate that we are in a corrective phase that may ended in wave IV or could still extend in wave C in the following period of time. If the price close above the crucial fibonacci retracement level around 1.2550, we may be looking at a continuation and a possible channel breakup that will puss the pair in 1.2650 fibonacci projection level and will form wave C.

For next week's trading ideas, I recommend placing a sell order above the 1.2650 level where the wave 4 will extend, targeting a drop below 1.21. The MACD histogram shows signs of rolling over, supporting an upper leg that will form wave C and will complete wave 4. However, if the pair breaks down the ascending corrective channel the market will tell us that wave 4 is already complete with a truncated wave C and we are going below 1.21 targeting the 61.8% fibonacci long term retracement level, forming wave 5 before another correction or bounce will emerge.
EUR/JPY: Navigating the Cross Currency
Lastly, the EUR/JPY chart reveals an intriguing scenario. The pair has been consolidating between 155.00 and 166.00 for several months. This period of market adjustment is notable as it often precedes a breakout with Bank of Japan raising interest rates and Europe drooping down points after points. Historical data indicates that breakouts in this range have led to moves of up to 900 pips in prior instances before entering in consolidation.
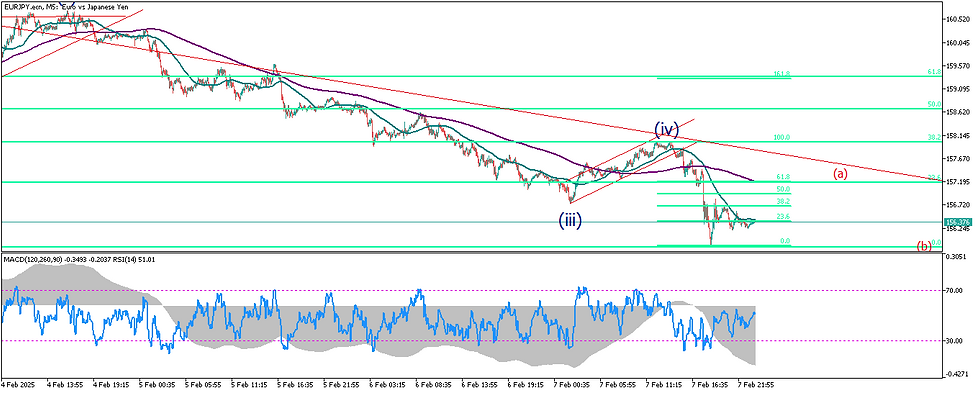
Based on my analysis, I suggest selling this pair below 158.00 with a target of 154.40, which has previously acted as support and look there for a break or a bounce. On the flip side, if the price rises above 158.00, it would be prudent to prepare buy orders targeting the range upper levels around 163.00 as consolidation will continue.
Strategic Outlook for the Week Ahead
Navigating the forex landscape requires a solid understanding of price charts and market trends. As we look ahead to the upcoming trading week, my focus on gold, GBP/USD, and EUR/JPY offers a strategic approach to capitalize on their potential fluctuations. Always consider your risk tolerance and stay informed about economic indicators that could impact these markets. Here's to unlocking profitable opportunities next week!


Comments